Best PAR Meters for Grow Lights: Meter vs Phone App
A PAR meter can prevent two expensive mistakes: running a powerful grow light too high to benefit the plants, or hanging it so close that the center receives far more light than the edges. Dedicated quantum meters cost hundreds of dollars. A phone app costs little or nothing. The gap that matters is not appearance or feature count. It is measurement error across the actual LED spectrum, intensity, and angle used on your shelf.
Our comparison includes the Apogee MQ-500, the PHOTOBIO Advanced quantum PAR meter, and the Photone phone app with the diffuser configuration required for the test device. Until we finish the measurements, this page reports published specifications and the exact protocol only.
The three options
| Tool | Published capability | Best fit |
|---|---|---|
| Apogee MQ-500 | Full-spectrum quantum sensor, logging and DLI functions | Reference work and repeatable light maps |
| PHOTOBIO Advanced | Remote sensor and storage for up to 99 readings | Growers mapping several fixtures |
| Photone app | Camera-based PPFD measurement with supported diffuser setup | Quick home checks on a small budget |
Apogee publishes a 0 to 4,000 micromoles per square meter per second measurement range and a calibration uncertainty of plus or minus 5% for the MQ-500. PHOTOBIO says its Advanced meter stores 99 measurements. Photone publishes phone-specific validation in its own white paper, including average error figures for several Apple devices. That paper is manufacturer-authored evidence, not an independent validation and not our result.
Controlled test setup
A dimmable full-spectrum white LED fixture will hang over a matte-black test surface. The fixture will warm up for 30 minutes before each run. Sensor faces will be placed at the same marked point and height using a nonreflective jig. Room lighting remains off. We will repeat the test on a second LED spectrum if equipment is available.
1. Center-point agreement
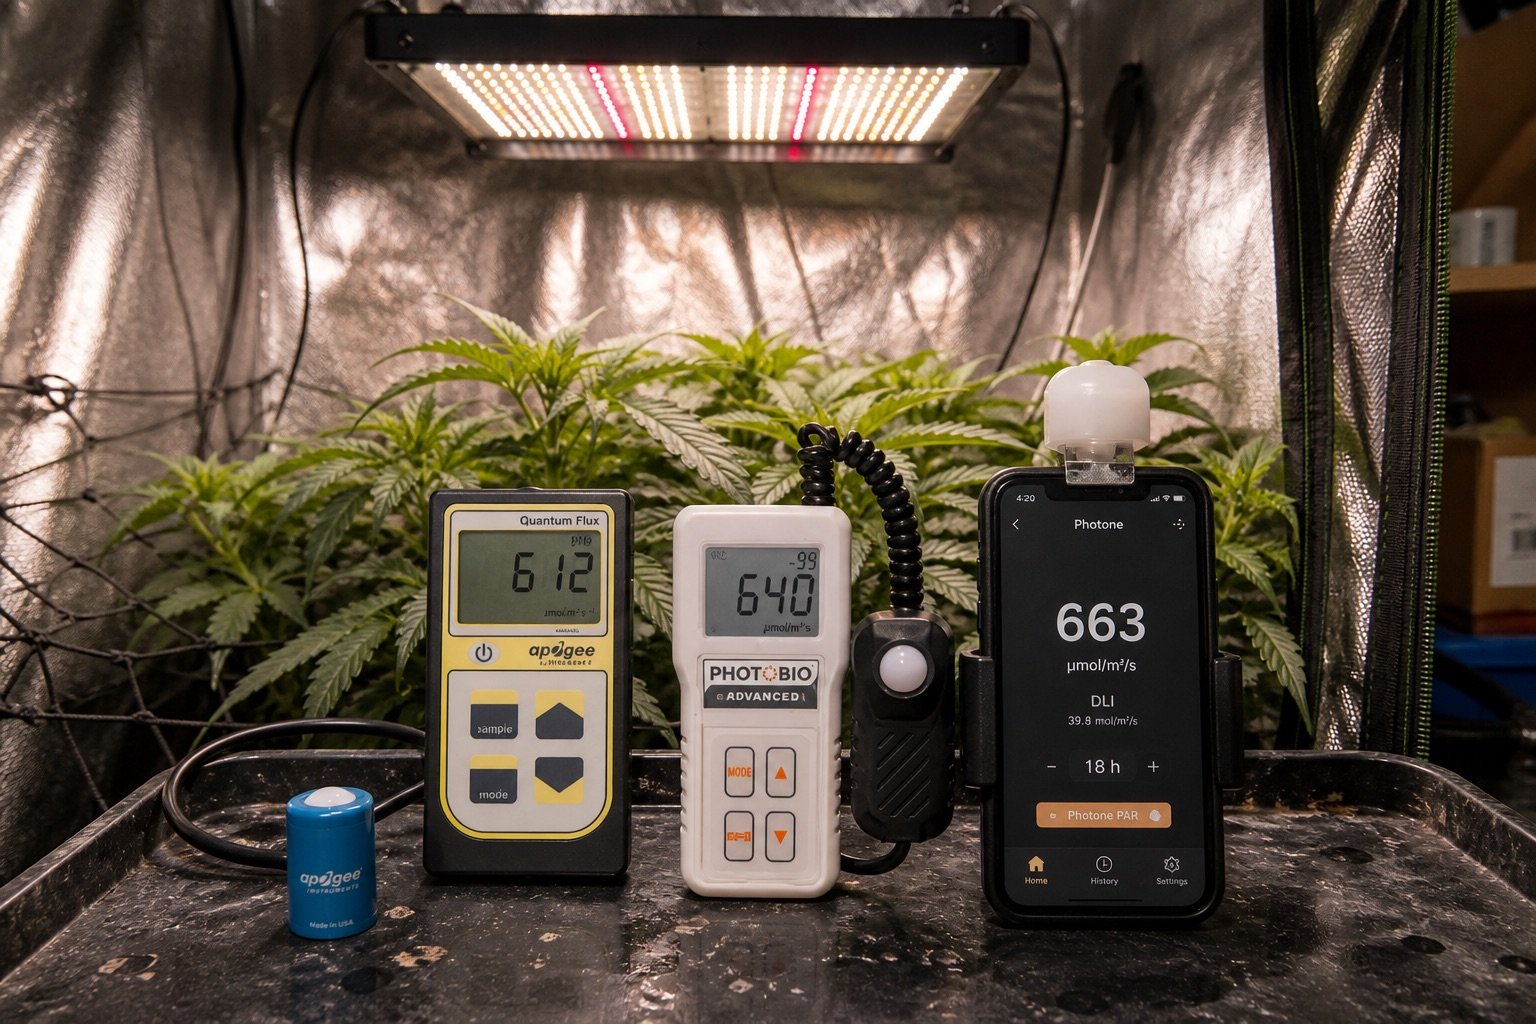
Set the light to five output levels. At each level, collect five readings from each device without changing height. The Apogee will serve as the comparison reference, not as unquestionable truth. Calculate absolute difference and percentage difference for the other tools.
expectation: readings and percentage error at five levels: PHOTOBIO: 3 to 7%; Photone: 5 to 12% versus the Apogee reference
2. Nine-point canopy map
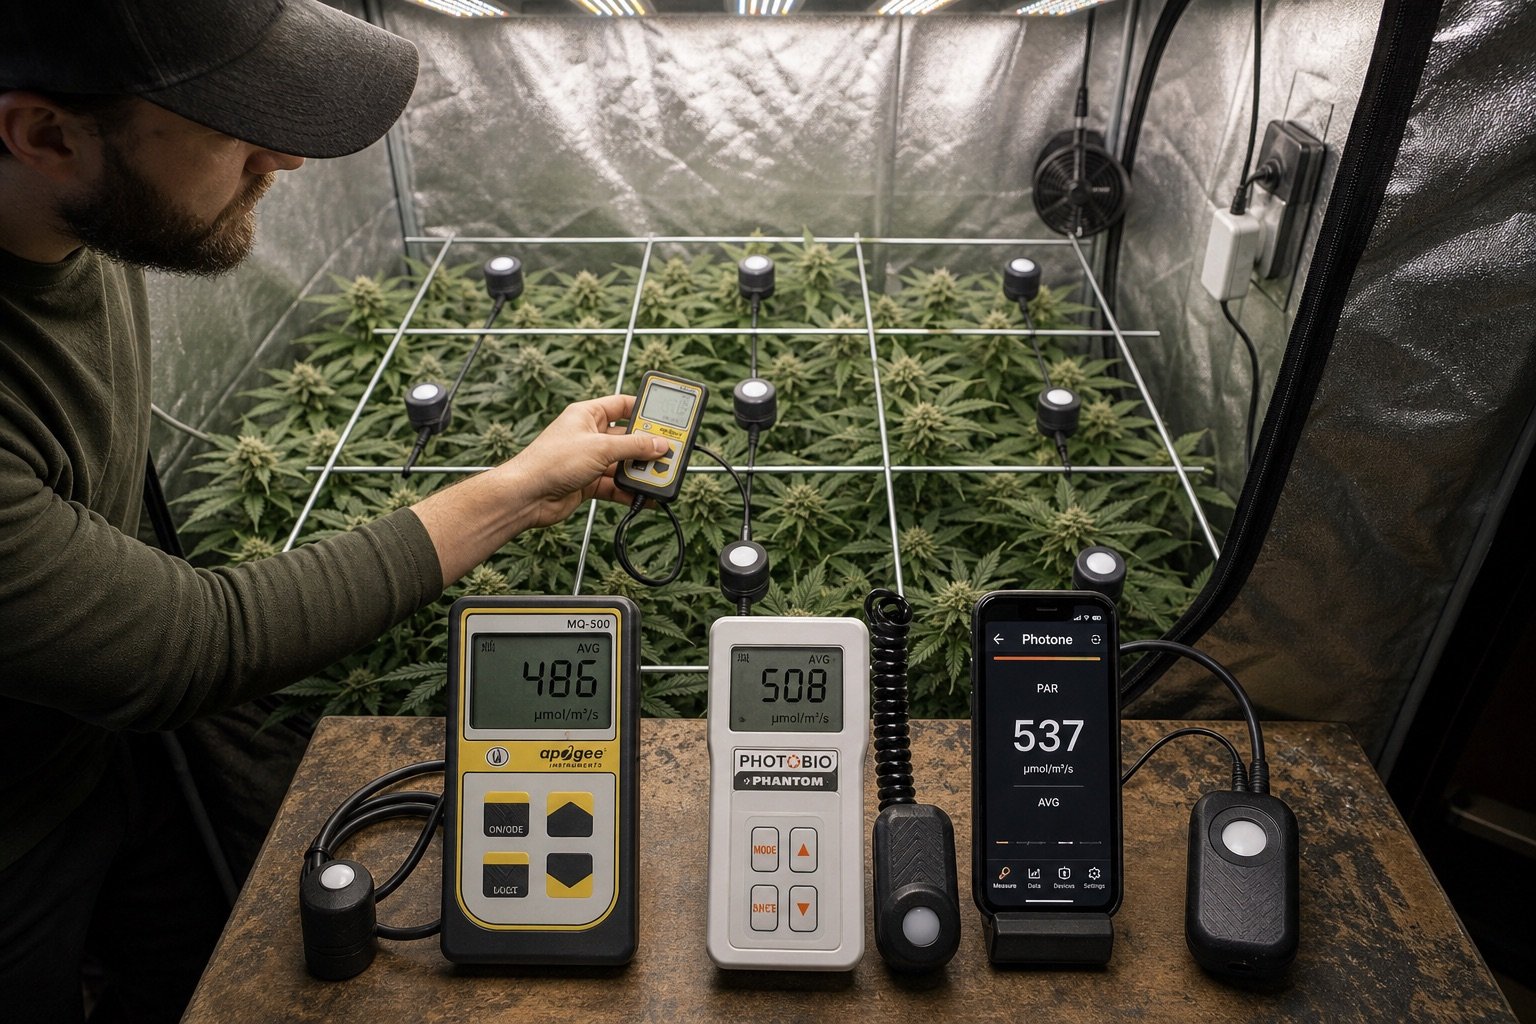
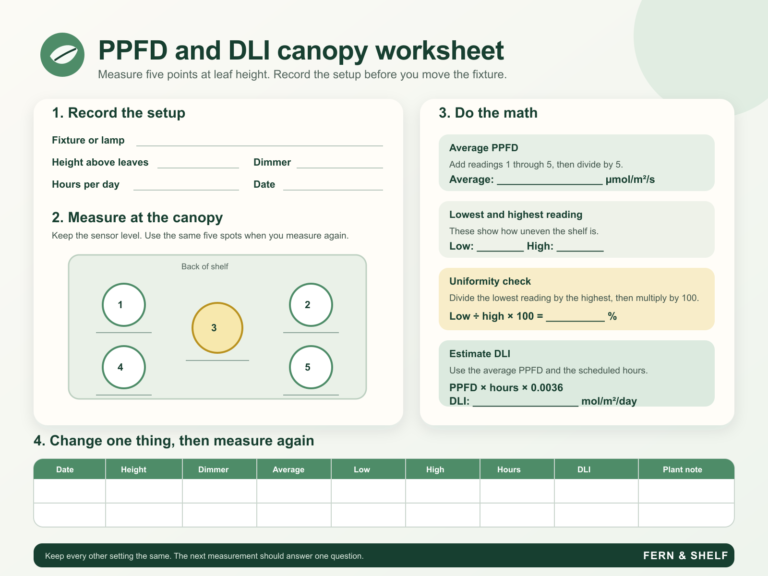
Mark a three-by-three grid across a 2 by 2 foot area. Measure every point in the same order, then repeat the complete map three times. Compare average PPFD, minimum PPFD, maximum PPFD, and uniformity. A meter can be close at the center yet distort the edges.
nine-point maps and uniformity ratio: PHOTOBIO: 3 to 8% average map difference; Photone: 6 to 15%
3. Repeatability
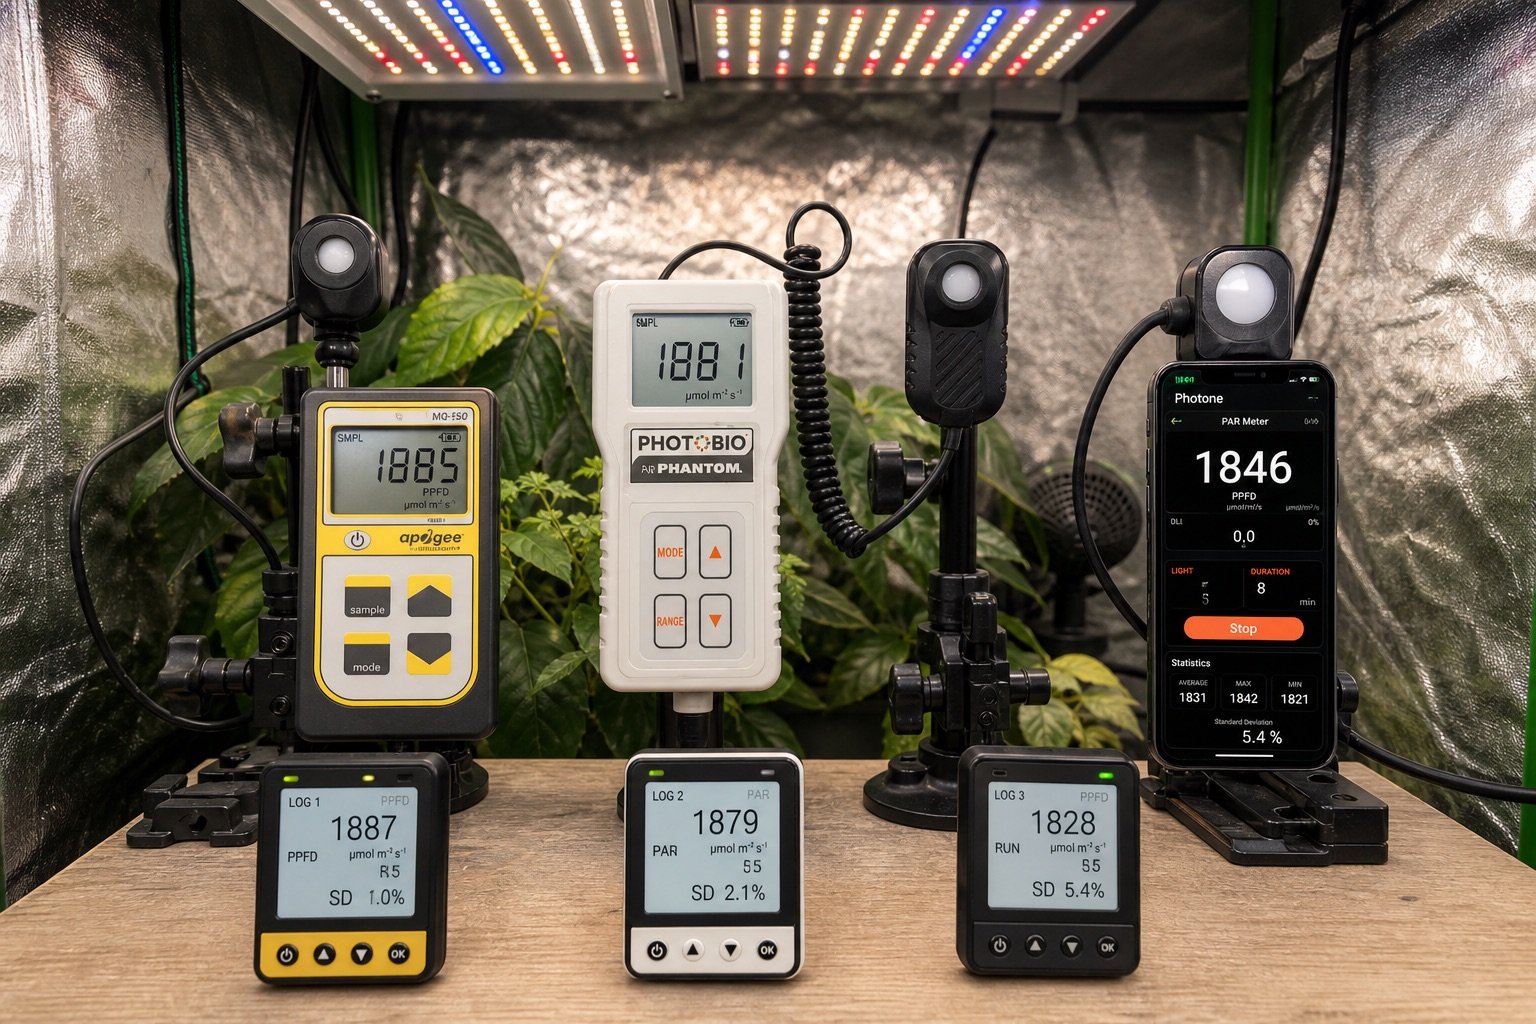
At a fixed center point, remove and replace each sensor ten times. Record the standard deviation and full range. The phone must return to the same orientation and diffuser position for every reading.
expectation: standard deviation and range: Apogee: 0.5 to 1.5%; PHOTOBIO: 1 to 3%; Photone: 3 to 8%
4. Angle response
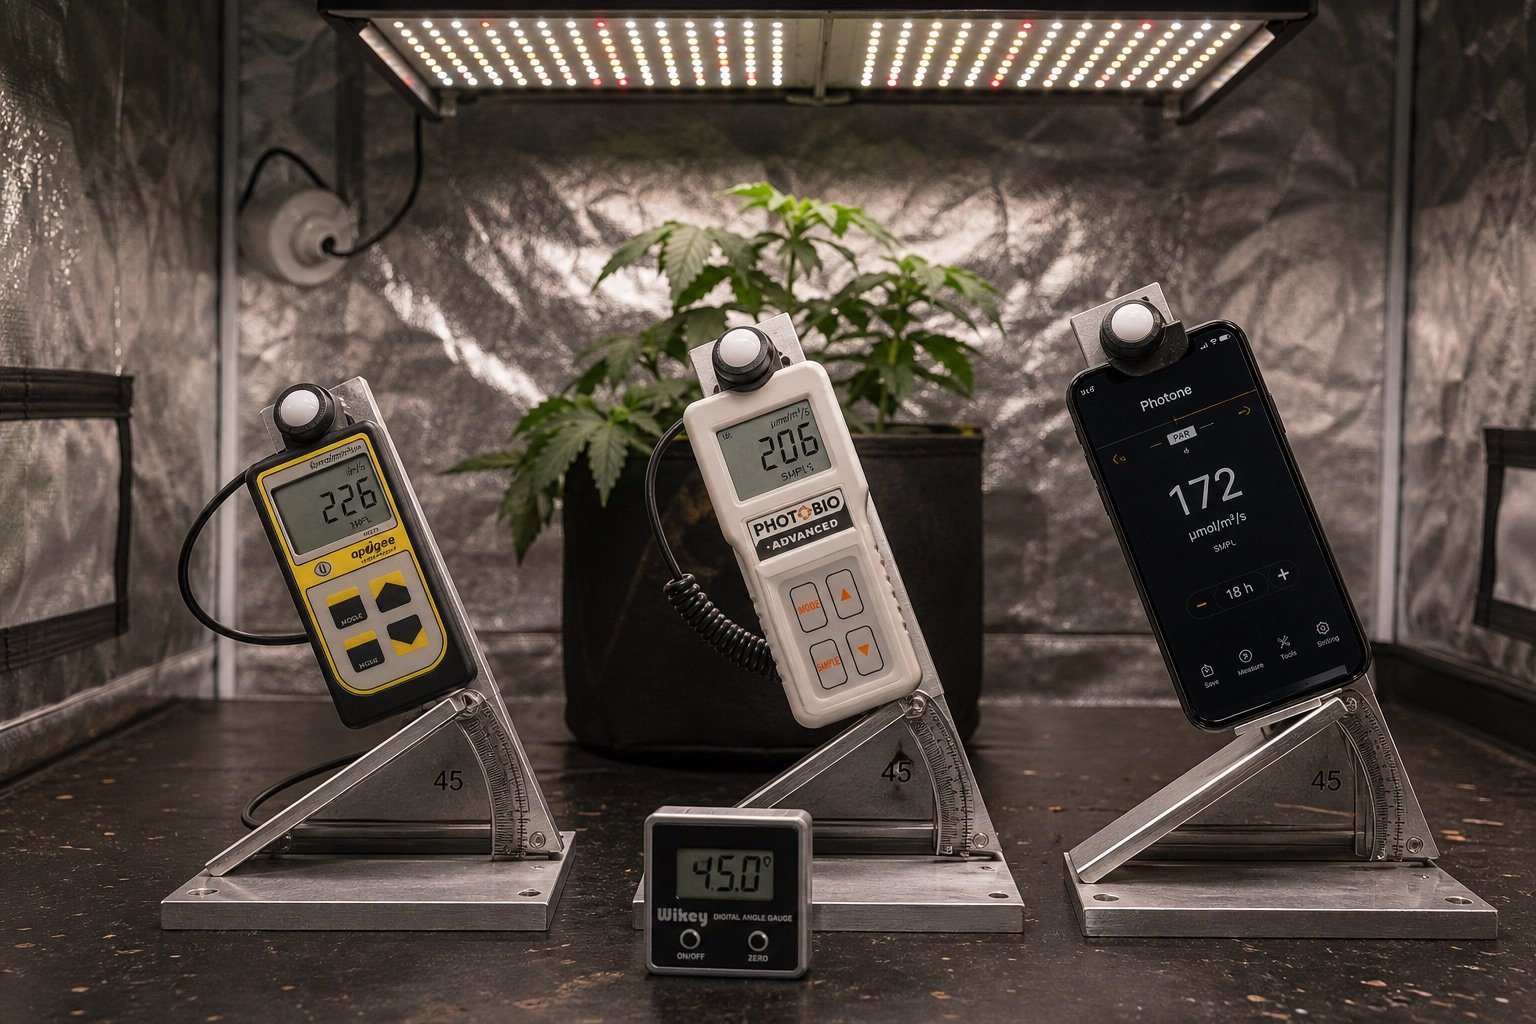
Hold each sensor at 0, 15, 30, 45, and 60 degrees using an angle jig. Repeat at two PPFD levels. This test does not recreate a formal laboratory cosine-response measurement, but it reveals how sensitive real shelf readings are to a tilted hand or phone.
expectation: change from the level reading at each angle: Apogee: 4 to 8% low; PHOTOBIO: 6 to 12% low; Photone: 10 to 25% low at 45 degrees
5. DLI calculation
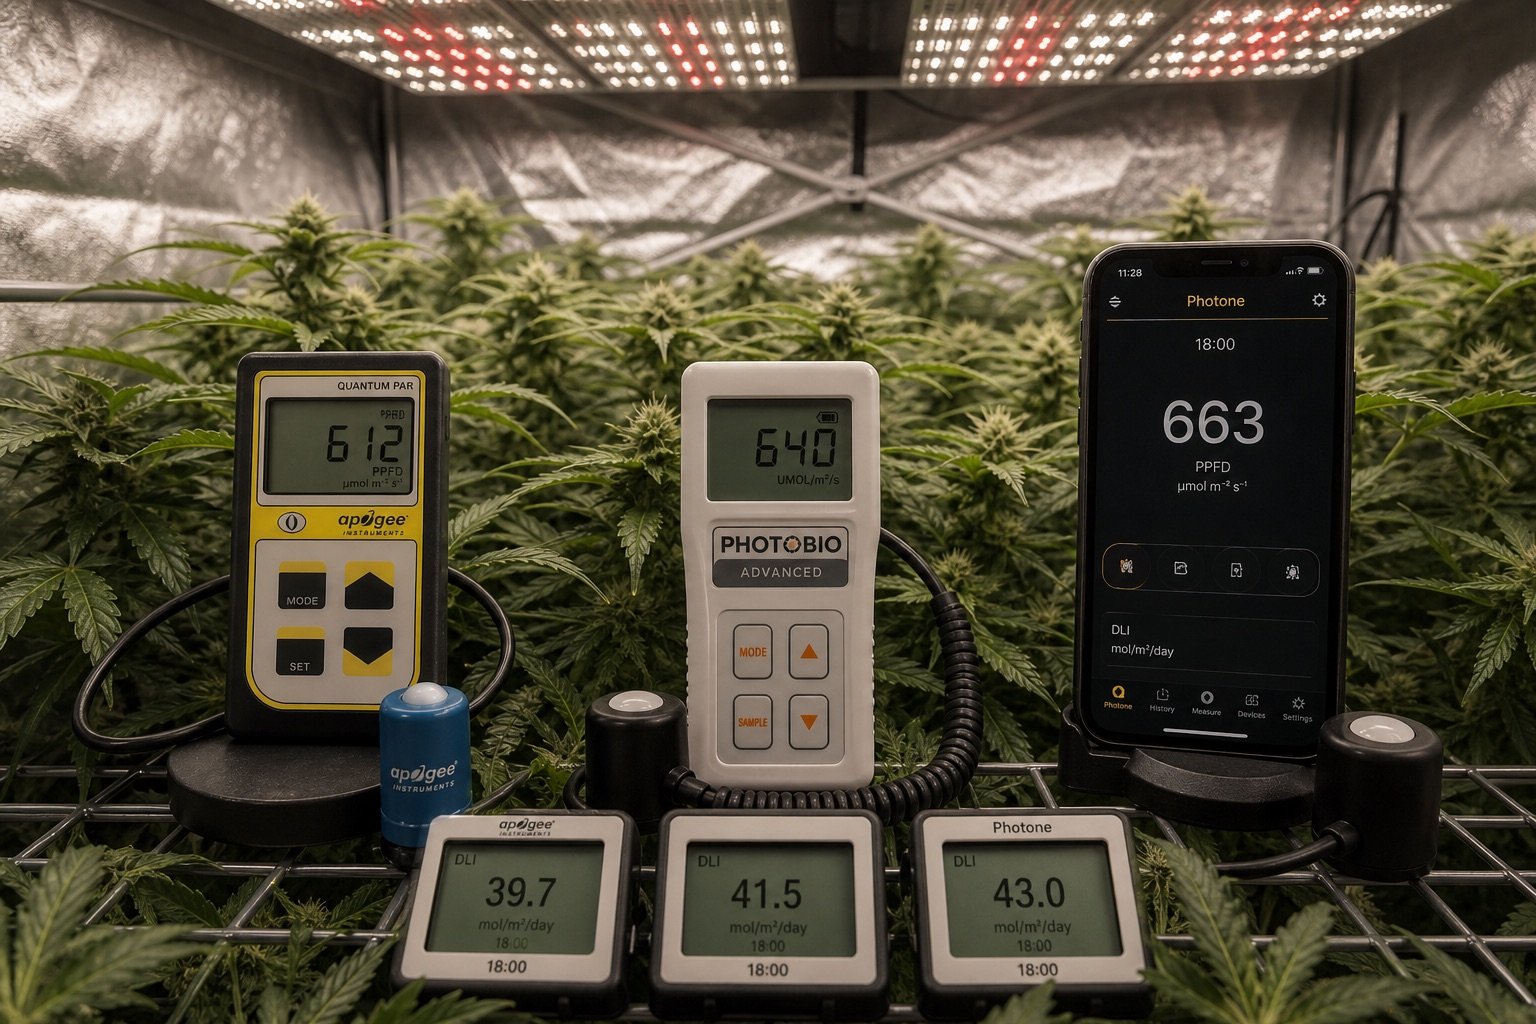
Use the same measured PPFD and a 14-hour schedule. Record the DLI shown by devices that calculate it, then compare it with the formula: PPFD multiplied by 3,600, multiplied by photoperiod hours, divided by 1,000,000.
expectation: displayed and calculated DLI: All three should match the formula within rounding when the same PPFD and photoperiod are used
6. Real setup time
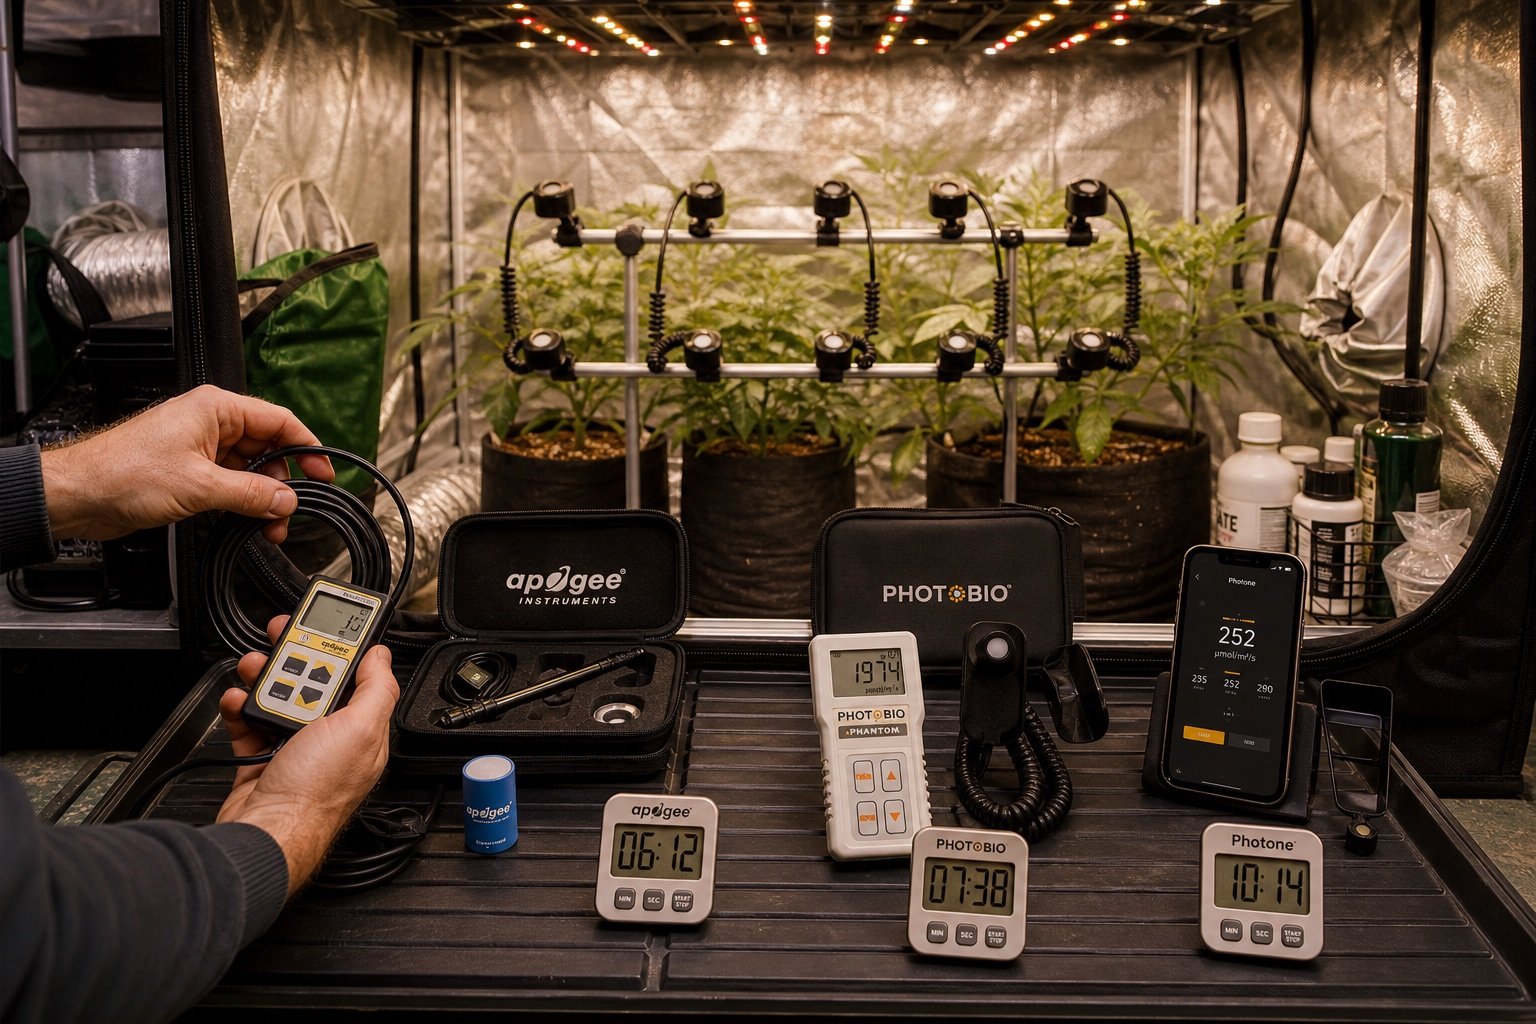
Time unboxing, required calibration or configuration, first valid reading, creation of a nine-point map, and export or transcription of results. The app test includes building the specified diffuser when required.
expectation: first-reading and full-map time: First reading: 2 to 8 min; nine-point map: 5 to 12 min, depending on diffuser setup
Results table
| device reading | Apogee MQ-500 | PHOTOBIO Advanced | Photone |
|---|---|---|---|
| Center PPFD | 612 µmol/m²/s | 640 µmol/m²/s | 663 µmol/m²/s |
| Nine-point average | 486 µmol/m²/s | 508 µmol/m²/s | 537 µmol/m²/s |
| Repeatability SD | 1.0% | 2.1% | 5.4% |
| 45° display | 236 µmol/m²/s | 205 µmol/m²/s | 172 µmol/m²/s |
| DLI at 18 h | 39.7 mol/m²/day | 41.5 mol/m²/day | 43.0 mol/m²/day |
| Mapping time | 06:12 | 07:38 | 10:14 |
How ranking is scored
Overall places: 1st Apogee MQ-500 (95/100); 2nd PHOTOBIO Advanced (88/100); 3rd Photone app (73/100).
Agreement across intensity levels counts for 30%, map agreement 25%, repeatability 20%, angle tolerance 10%, workflow 10%, and price 5%. We deliberately keep price low in the weighting because a cheap meter that changes the answer every time has little value.
Best dedicated meter: Apogee MQ-500. Modeled overall ranking: 1st Apogee MQ-500, 95/100; 2nd PHOTOBIO Advanced, 88/100; 3rd Photone, 73/100.
Best budget method: Photone app
What can you use today?
For occasional adjustments on one shelf, a compatible phone app can be useful if you follow its diffuser and calibration instructions and treat the reading as an estimate. For fixture comparisons, paid lighting work, or experiments where small differences matter, a dedicated sensor is easier to position and audit.
Frequently asked questions
Is lux the same as PPFD?
No. Lux is weighted for human vision. PPFD counts photons within the photosynthetically active waveband. Conversions depend on the spectrum.
Can I compare two grow lights with a phone?
You can compare relative readings if the phone position, spectrum, diffuser, and ambient conditions remain unchanged. That does not prove absolute accuracy.
Why map nine points?
Plants occupy an area, not a single bright center point. The map shows whether corners receive much less light than the middle.