Microgreens Seed Density Chart: 7 Reliable Starting Rates
Last updated: September 5, 2026.
Affiliate disclosure: As an Amazon Associate I earn from qualifying purchases. Links marked “paid link” may earn Fern & Shelf a commission at no extra cost to you. Read our full Affiliate Disclosure.
Start here: For a complete overview, see our How to Grow Microgreens at Home.
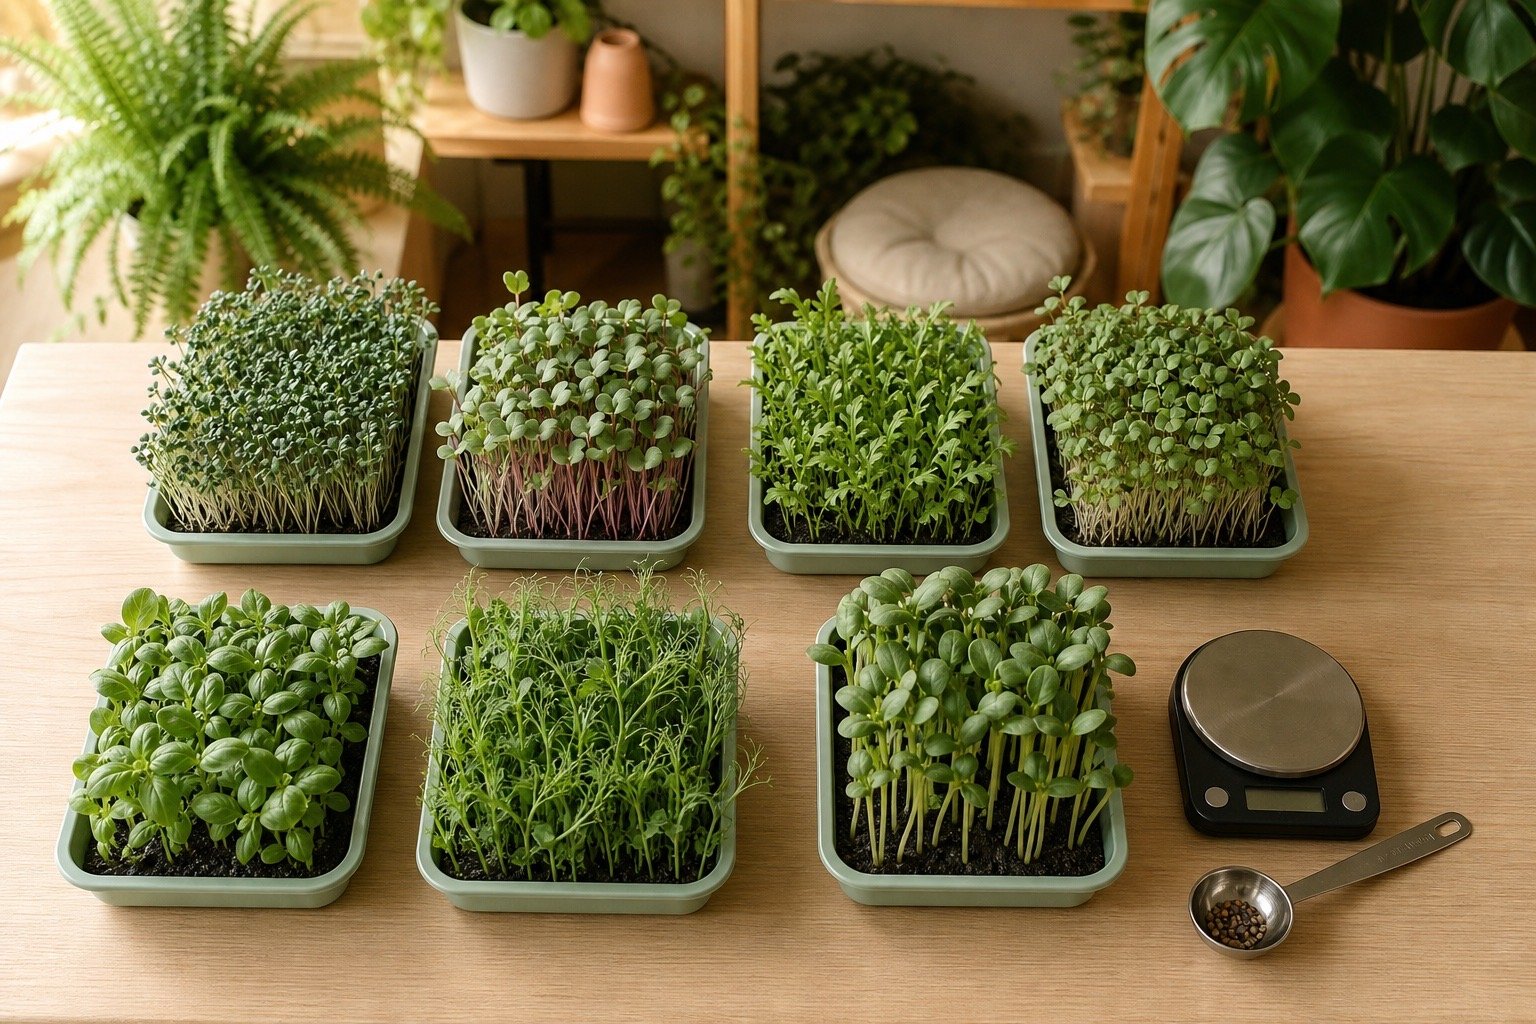
A microgreens seed density chart is useful only when you treat it as the first trial, not a guaranteed recipe. The same number of grams can produce a different stand when the variety, seed lot, germination percentage, season, medium, or tray dimensions change. Even two trays sold as 10 by 20 inches may not have the same plantable area.
The rates below are cautious home-grower estimates for a nominal 10 by 20 tray. For the area calculations on this page, the nominal reference is 200 square inches (1,290.32 square centimetres). It is a calculation baseline, not the measured interior of every 1020 tray. Record the actual seed weight, inspect airflow and emergence, then adjust the next tray in small steps. That modest approach is more reliable than pretending there is one scientifically exact rate for every bag of seed.
Microgreens seed density chart for a nominal 10 by 20 tray
| Crop group | Starting estimate | Soak? | What may justify less seed |
|---|---|---|---|
| Broccoli and kale | 10 to 15 g | Usually no | Warm, humid room or weak airflow |
| Radish and daikon | 15 to 25 g | Usually no | Large seed lot or dense center growth |
| Mustard and mizuna | 8 to 14 g | Usually no | Very fine seed or slow surface drying |
| Arugula | 8 to 12 g | No | Gel-forming seed or wet medium |
| Basil | 6 to 10 g | No | Gel-forming seed, poor airflow, or a small-seeded variety |
| Sunflower | 90 to 140 g dry seed | Often crop-specific | Crowding after soaking, persistent hulls, or weak airflow |
| Pea shoots | 180 to 260 g dry seed | Often crop-specific | Large peas, expansion after soaking, or weak airflow |
These ranges are starting estimates synthesized from Extension frameworks, published research, and the large difference between small and large seed. They are not measured results from a Fern & Shelf controlled trial. Penn State’s general guidance describes roughly 2 large seeds to 12 small seeds per square inch and reports 10 to 15 grams for many small-seeded microgreens in its own standard teaching trays. Pea and sunflower are heavier because each seed weighs far more, but they still need room for shoots and air.
If a seed supplier provides a tested rate for the exact cultivar and tray, begin there. Write down whether the number refers to dry or soaked seed. Water absorbed during soaking increases weight without increasing the number of plants.
Seed amounts for smaller trays
Measure the inside of your tray where the medium sits. A nominal 5 by 5 tray isn’t necessarily 25 square inches inside. The examples below use measured growing areas of 25, 100 and 200 square inches and scale the chart without changing its assumptions.
| Crop | 25 sq in | 100 sq in | 200 sq in reference |
|---|---|---|---|
| Broccoli and kale | 1.3 to 1.9 g | 5 to 7.5 g | 10 to 15 g |
| Radish and daikon | 1.9 to 3.1 g | 7.5 to 12.5 g | 15 to 25 g |
| Mustard and mizuna | 1 to 1.8 g | 4 to 7 g | 8 to 14 g |
| Arugula | 1 to 1.5 g | 4 to 6 g | 8 to 12 g |
| Basil | 0.8 to 1.3 g | 3 to 5 g | 6 to 10 g |
| Sunflower | 11.3 to 17.5 g | 45 to 70 g | 90 to 140 g |
| Pea shoots | 22.5 to 32.5 g | 90 to 130 g | 180 to 260 g |
All amounts refer to dry seed. Small-tray figures are rounded to 0.1 gram; that rounding doesn’t make the starting estimate more certain. For a different size, multiply the reference grams by your measured area and divide by 200. If you measure in centimetres, divide the area in cm² by 1,290.32 instead.
A round tray needs a different area calculation: π × diameter² ÷ 4. A growing surface 6 inches across has about 28.3 square inches. That scales our broccoli range to about 1.4 to 2.1 grams of dry seed. Both examples are proportional calculations, not results from growing trials.
For an interactive calculation using a separate species database, use Penn State Extension’s microgreens seed density calculator. Its assumptions and rates can differ from this chart. Don’t combine an output from one method with a second germination adjustment unless you know what the first calculation already includes.
Why one exact rate would be misleading
Seed density describes living material, not identical hardware. Penn State advises considering tray area, the crop’s target seed count per area, average seed weight, and germination. Its calculator uses average seed weight while acknowledging that seed weight can vary among lots.
Published experiments also find that density affects yield and plant form differently across species and varieties. More seed can raise yield per tray until crowding, competition, disease pressure, or poor individual growth erases the benefit. That turning point changes with the rest of the system.
| Variable | What changes | Practical response |
|---|---|---|
| Plantable tray area | Same grams cover a different surface | Scale by measured length times width |
| Seed lot | Seed size and germination vary | Run a germination check and record the lot |
| Season | Warm, humid air dries slowly | Start lower when disease pressure rises |
| Medium | Water holding and surface texture differ | Adjust moisture before changing density |
| Light and airflow | Dense stems stay damp or stretch | Correct the environment before adding seed |
| Harvest stage | Older plants occupy more space | Use a lower rate for a longer crop |
The chart therefore belongs beside notes from each crop. If your goal is broader production planning, keep it separate from the economics in microgreens startup costs, the equipment choices in our microgreens starter kit, and the staged purchases in microgreens scaling equipment.
Measure the real growing area
Measure the inside length and width that actually hold medium. Ignore the outer lip. Multiply those numbers to get square inches. A tray with 190 square inches of plantable area should not receive the same seed as a tray with 210 square inches merely because both are marketed with the same rounded size.
Tray area = inside length × inside width
Then scale a known starting rate from a reference tray:
Seed for your tray = reference seed weight × your tray area ÷ reference tray area
Example: suppose a 200-square-inch reference tray starts with 12 grams of broccoli seed. A tray with 150 square inches would start at 12 × 150 ÷ 200, which equals 9 grams. That is a proportional estimate, not proof that 9 grams is optimal.
Adjust for germination without faking precision
A germination percentage estimates how many seeds are likely to emerge under the test conditions. Penn State gives this adjustment:
Adjusted seed count = target viable seedlings ÷ germination fraction
If you want 600 viable seedlings and the lot tests at 90 percent, use 600 ÷ 0.90, or about 667 seeds. In weight form, a cautious working adjustment is:
Adjusted grams = baseline grams × baseline germination fraction ÷ current germination fraction
Imagine your baseline assumes 95 percent germination, but the current lot tests at 85 percent. A 12-gram baseline becomes 12 × 0.95 ÷ 0.85, or about 13.4 grams. Do not automatically compensate for a very poor lot by packing much more seed into the tray. Low germination can also bring uneven timing, decay, and wasted seed. Replacing the lot may be the better decision.
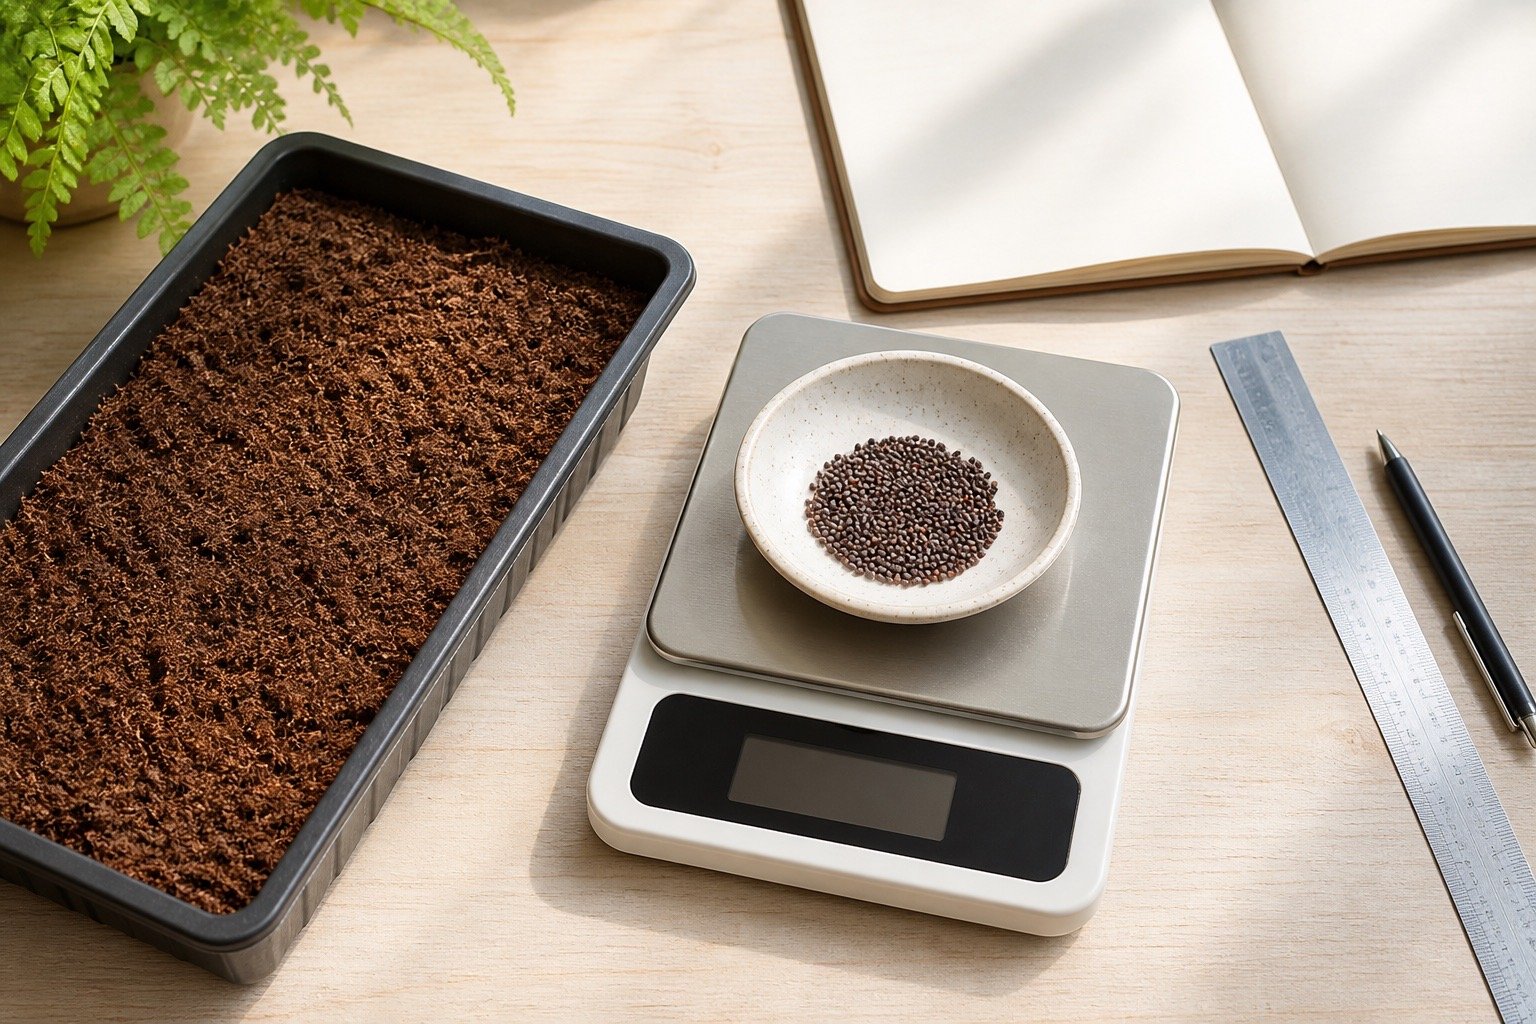
A scale reading to 0.1 gram is plenty for most home trays. Displaying two decimal places does not make a biological estimate more accurate.
Search Amazon for a 0.1-gram digital scale (paid link)
How to calibrate a rate in three trays
When seed is expensive or the crop is new to you, split the first test into three small identical trays. Use the chart midpoint in one. Sow the second roughly 10 percent lighter and the third roughly 10 percent heavier. Keep tray area, medium depth, water, light, temperature, and harvest stage as similar as practical.
Record dry seed weight, seed lot, germination, date, soaking method, tray area, emergence uniformity, disease or collapse, harvest weight, and anything that made harvest awkward. A high yield is not a win if the center stayed wet, stems were weak, or cleaning took longer.
The simplest comparison metric is:
Yield factor = harvested fresh weight ÷ dry seed weight
Use it alongside quality observations. A tray yielding 8 grams of crop for every gram of seed may be preferable to a denser tray yielding 8.3 when the denser one has poorer airflow and more waste. Do not compare yield factors across different crops as if they had the same seed cost, plant size, or harvest stage.
Starting rates for small seeds
Broccoli, kale, mustard, mizuna, arugula, and basil occupy the lower gram ranges because individual seeds are small. A few grams can represent hundreds or thousands of seeds. Spread them evenly rather than chasing a solid blanket.
Our 10 to 15 gram broccoli and kale range is a starting estimate. Penn State reports 10 to 15 grams for a 12 by 20 inch teaching tray, so its tray reference is different from this chart’s nominal 10 by 20 baseline. Radish seed is larger, so its useful starting weight is often higher. Follow the crop-specific methods for broccoli and radish; this page focuses on seed amounts.
Arugula and basil become mucilaginous when wet. Their gel helps hold moisture around the seed, but a thick sticky layer is hard to spread and may stay damp. Sow them dry onto a prepared surface and start near the lower side of the range if your room is humid.
Search Amazon for untreated small-seed microgreen varieties (paid link)
Starting rates for sunflower and peas
Large seeds need a different mental model. A gram contains far fewer peas or sunflower seeds than broccoli seeds. The dry-weight ranges in the chart are broad because cultivar and seed size matter greatly. Soaking changes the scale reading, so weigh the dry lot first.
Sunflower hulls can trap moisture, and damaged or poorly germinating seeds can decay. A dense canopy makes inspection harder. The full sunflower microgreens guide covers soaking, germination, hulls, and harvest.
Peas swell substantially in water and develop thick shoots. Leave enough physical room for that expansion. The pea shoot guide explains the crop method, including the limits of assuming every tray will regrow well.
Search Amazon for untreated sunflower and pea microgreen seed (paid link)
Signs that the tray is too dense
An overcrowded tray often looks impressive for a day. Then the center stays damp, stems stretch, plants fall across one another, and harvest becomes messy. Watch for a wet center long after the edges dry, matted stems, uneven height, pale lower tissue, poor airflow, or suspicious spreading growth.
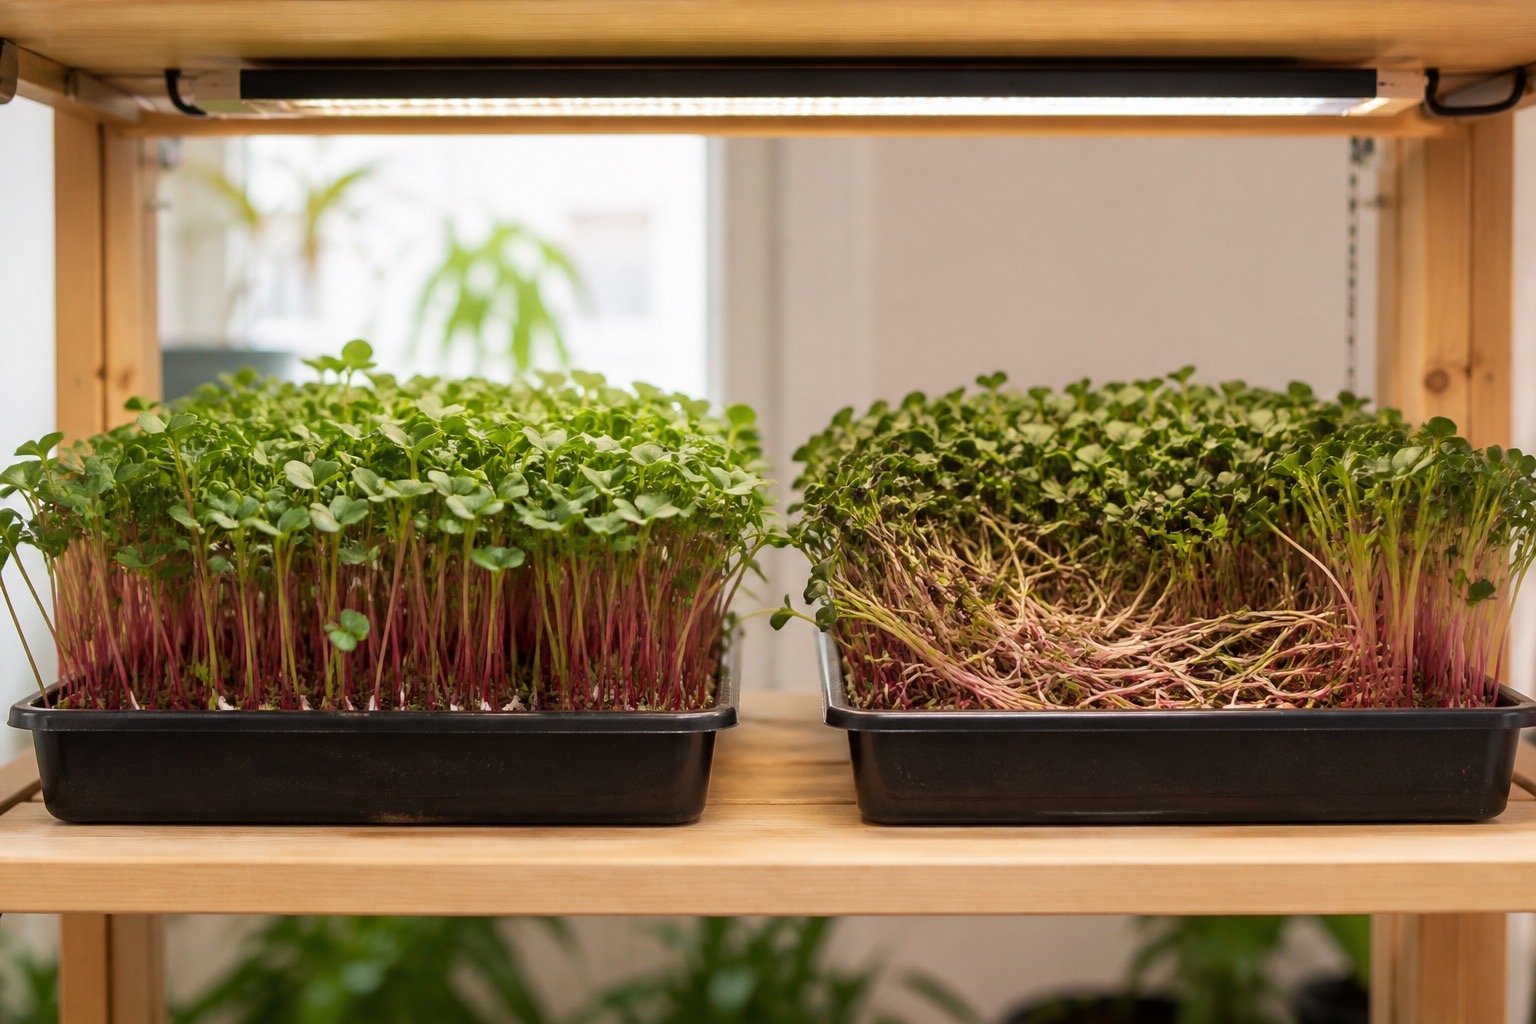
Before lowering density, confirm that the issue is not excess water, insufficient light, or a cover left on too long. Density interacts with those conditions. Change one variable on the next run so the result teaches you something.
Signs that the tray is too sparse
A sparse tray has broad bare areas even though germination is good and evenly distributed. Harvest weight may be low relative to the space, and tall varieties may lack mutual support. First check whether seed rolled into the edges or whether dry pockets reduced germination.
If the environment and emergence are sound, raise the next dry seed weight by a small percentage. Ten percent is easier to interpret than a dramatic jump. Keep the rest of the method steady.
Frequently asked questions
Is this chart exact for every 10 by 20 tray?
No. It provides starting estimates. Measure the plantable area, identify the seed lot, and record results. Tray labels, cultivars, and germination differ.
Should I weigh seed before or after soaking?
Record dry seed weight. Soaked seed includes absorbed water, so comparing its weight with a dry-seed chart would inflate the apparent sowing rate.
Can I use tablespoons instead of a scale?
You can calibrate a volume measure for one seed lot, but a scale is easier to repeat. Seed size and the way a spoon is filled change the amount.
Should poor germination always be corrected with more seed?
No. A modest mathematical adjustment can help with an otherwise sound lot. Very poor or uneven germination may justify replacing the seed because extra nonviable seed can decay and crowd the surface.
Why does my best rate change in summer?
Warm, humid conditions slow surface drying and can raise disease pressure. Penn State notes that lower rates may be appropriate in summer. Airflow, watering, and temperature must be considered with density.
Sources
Sources checked August 12, 2026.
- Penn State Extension: The ABCs of Microgreens
- Penn State Extension: Growing Microgreens
- Penn State Extension: A Step-By-Step Guide for Growing Microgreens at Home
- Virginia Tech Extension: Introduction to Microgreen Production in Indoor Vertical Farms and Greenhouses
- Plants: Microgreens, Optimising Seed Density and Exploring Light
- Horticulturae: Optimising Sowing Density for Rapini, Kale and Cress